The system remains flat but we get some indication that it will not be for long now. The money has been parked on the money market and the situtation is as follows:
ActionsNothing
Account general informationsNAV: 10 729 996,29
Market Expo: 0,00
Open Positions: 0
Actual portfolio (included today actions)
Nothing
but observing the curves of the number of open trades, we can notice that we're certainly pretty close from a bounce back :

The blue curve indicates the number of trades either LONG on a BULL market or SHORT on a BEAR market that the system finds everyday. The purple curve gives its 10 days moving average and as one can notice we've been at lows since the 19th of May. Of course, this is just one of the many indicators used by the system to decide to resume taking positions, but it is closely noticed.
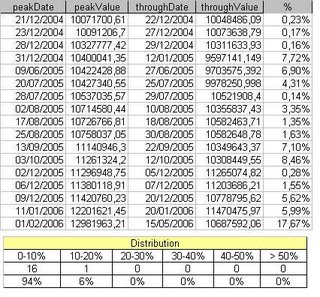
Furthermore, even though the system has been pretty quick acknowledging this correction in what remains a bull market, the peak to though made since Feb the 1st is the worse on this account made since the beginning of the run on Dec. the 20th 2004.
We report hereafter the complete P2T (Peak to Through) Table which gives the feeling of the investor diving from a Peak of the NAV to the next Through and then add some distribution data indicating that so far the system has made 16 P2T between 0% and 10% and one between 10% and 20%: